Histogram vs Bar Graph: Must Know Differences
In statistics, a histogram is a type of bar chart that is used to display the frequency distribution of continuous data by displaying the statistical information in the form of bars. It identifies the number of observations that fall within a given range of values, also known as a class or a bin.
A histogram chart is a visual representation of the distribution of numerical data that uses vertical bars to represent the distribution. It is possible to compare non-discrete values with the help of a histogram diagram.
For example, the number of students who received English subject marks on an exam in various ranges can be represented graphically using a histogram chart, as shown below.
What is Bar Chart?
An example of a bar chart is one that uses horizontal or vertical bars to compare the frequency, total number of items, sum, or average of data in different categories. A column chart is another name for this type of chart.
There are numerous types of category comparisons that can be carried out with the help of a bar chart, which is graphically represented by the bar chart. An axis, a label, scales, and bars are all common components of a bar chart. The bars represent measurable values such as percentages or numbers.
Bar plots are used to display a wide range of data, including quarterly sales, seasonal rainfall, and job growth, among other things. A double bar graph can be used to compare and contrast two different data sets in some cases. It can also be used to quickly evaluate two or three data sets at the same time.
Example of Histogram
While constructing a Histogram, you need to take the observations and split them into a logical series of intervals called bins.
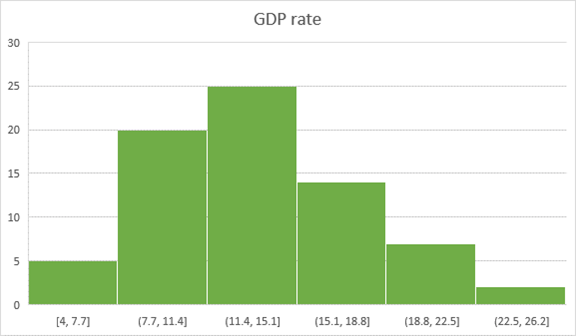
Above given chart showing the GDP rate range in a special year.
Example of Bar Chart
Here is a survey of 100 people about their favorite food
| Favorite Food | ||||
| Hot dog | Pizza | Burger | Sandwich | Pasta |
| 10 | 25 | 20 | 35 | 5 |
Bar Graph:
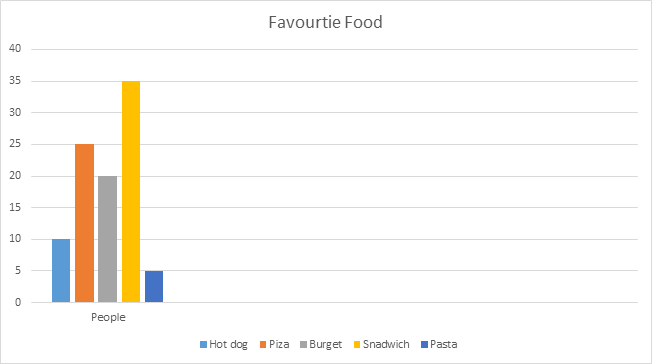
The above-given example shows the most liked food is Sandwich, and the least liked food is pasta in this survey.
Difference Between Histogram and Bar Chart

| Histogram | Bar Graph |
|---|---|
| The histogram is a term that refers to a graphical representation that shows data by way of bars to display the frequency of numerical data. | The bar graph is a graphical representation of data that uses bars to compare different categories of data. |
| Distribution of non-discrete variables. | Comparison of discrete variables. |
| Bars touch each other, so there are no spaces between bars. | Bars never touch each other, so there are spaces between bars. |
| In this type of graph, elements are grouped so that they are considered as ranges. | In this type of graph, elements are taken as individual entities. |
| Histogram width may vary. | The bar chart is mostly of equal width. |
| To display the frequency of occurrences. | To compare different categories of data. |
| In Histogram, the data points are grouped and rendered based on its bin value. | In the Bar graph, each data point is rendered as a separate bar. |
| The items of the Histogram are numbers, which should be categorized to represent data range. | As opposed to the bar graph, items should be considered as individual entities. |
| In Histogram, we cannot rearrange the blocks. | Bar graph, it is common to rearrange the blocks, from highest to lowest |
Advantages of Histogram
When dealing with numerical or categorical data, a bar graph can be used.
Each data category is represented by a bar graph, which represents a frequency distribution.
Multiple categories are represented by relative numbers or proportions in this graph.
A visual representation of a large data set is useful for summarising it.
Key values can be estimated with a single glance.
Close numbers or proportions should be displayed in outline form.
Large data sets presented in a visual format aid in the clarification of trends more effectively than tables.
The disadvantages of using a histogram
The following are the disadvantages and drawbacks of the histogram:
Advantages of Bar Graphs
Because the data is organised into categories, you will not be able to read exact values.
It is only applicable to continuous data.
It is difficult to compare two data sets when using the Histogram tool.
Because of the use of intervals in the Histogram, it is impossible to calculate an exact measure of central tendency. a
Bar graphs have a number of disadvantages.
The following are the disadvantages and drawbacks of using a bar graph:
Disadvantages of Histogram
A bar graph only shows the frequencies of the elements in a data set, and it is not a visual representation of the data.
With the Bar graph, you’ll need to provide more explanation.
There are no key assumptions, causes, effects, or patterns revealed by this study.